No. 05of 22LandmarkResearch
What-if motion forecasting on the nuScenes driving dataset
Ego-contingent trajectory prediction
An LSTM model trained on the nuScenes driving dataset that predicts how a nearby road user responds to what the ego vehicle plans to do: carry on, brake or accelerate. Written up as an IEEE-format paper, peer-reviewed (three reviews), on which I am a co-author.
- When
- Oct 2025 – May 2026
- Status
- Research
- Team
- RV University course research project. The paper lists six authors: students and faculty.
- Role
- Co-author of the paper.
Progress
Progress75%
Pipeline, paper, simulators and a full 850-scene retrain all exist and ran. The paper's methods text still needs aligning with the code.
What comes next
- Write the 850-scene results into the paper, with position errors in meters and a simple baseline, as the reviewers asked.
- Align the paper's methods section with what the code does.
- Record the driving simulator; there is no footage of it yet.
0.449m/s
average displacement error after retraining on all 850 scenes
In velocity space: the model predicts velocities, so this is not comparable with position errors in meters. A result of the May 2026 code, not of the paper.
Retrain metrics file (scaled_training/03_train/metrics_full.json)Verified. Backed by a file or public page that has been checked.Retrain metrics file (scaled_training/03_train/metrics_full.json) — Read in the project audit of 13 November 2026.0.515m/s
average displacement error of the paper's original model, trained on 10 scenes
From a notebook that split its data at random by sample, which can leak between training and test. Velocity space.
Original training notebook (Training_3.ipynb, cell 32)Verified. Backed by a file or public page that has been checked.Original training notebook (Training_3.ipynb, cell 32) — Read in the project audit of 13 November 2026.850
nuScenes scenes in the retrain, up from 10 in the paper's model
205,768 training and 38,312 validation samples, split by scene with the dataset's official 700 and 150. The retrain is in the code, not yet in the paper.
Retrain metrics file and training log (metrics_full.json, train.log)Verified. Backed by a file or public page that has been checked.Retrain metrics file and training log (metrics_full.json, train.log) — Read in the project audit of 13 November 2026.26.5ms
mean time for one prediction
Batch of one; the 99th percentile is 28.9 ms. At a batch of 64 it makes 1,781 predictions a second.
Latency result file (scaled_training/04_eval/latency_analysis/latency_metrics.json)Verified. Backed by a file or public page that has been checked.Latency result file (scaled_training/04_eval/latency_analysis/latency_metrics.json) — Read in the project audit of 13 November 2026.3
peer reviews received for the paper, 6 May 2026
Rated borderline, borderline and accept. No acceptance notice, venue name or DOI is on file.
Reviewer comments file (Reviewer_Comments.docx, 6 May 2026)Verified. Backed by a file or public page that has been checked.Reviewer comments file (Reviewer_Comments.docx, 6 May 2026) — Read in the project audit of 13 November 2026.12 of 12
tests passing in the project's test suite
Test results file (tests/test_results.json)Verified. Backed by a file or public page that has been checked.Test results file (tests/test_results.json) — Read in the project audit of 13 November 2026.Exhibit 01 · Video
What if I brake? One scene, three plans
- 0:00The past
- 0:03Real plan
- 0:06Brake plan
- 0:10Accelerate plan
The project's own animation of one sample, slowed down. Gray: the past paths of the target (upper left) and the ego vehicle (the long diagonal). Color: the ego vehicle's plan and, beside the target, the forecast under that plan, with the target's true path in blue. It shows how the forecast is conditioned on the plan, not how accurate it is.
Exhibit 02 · Compare
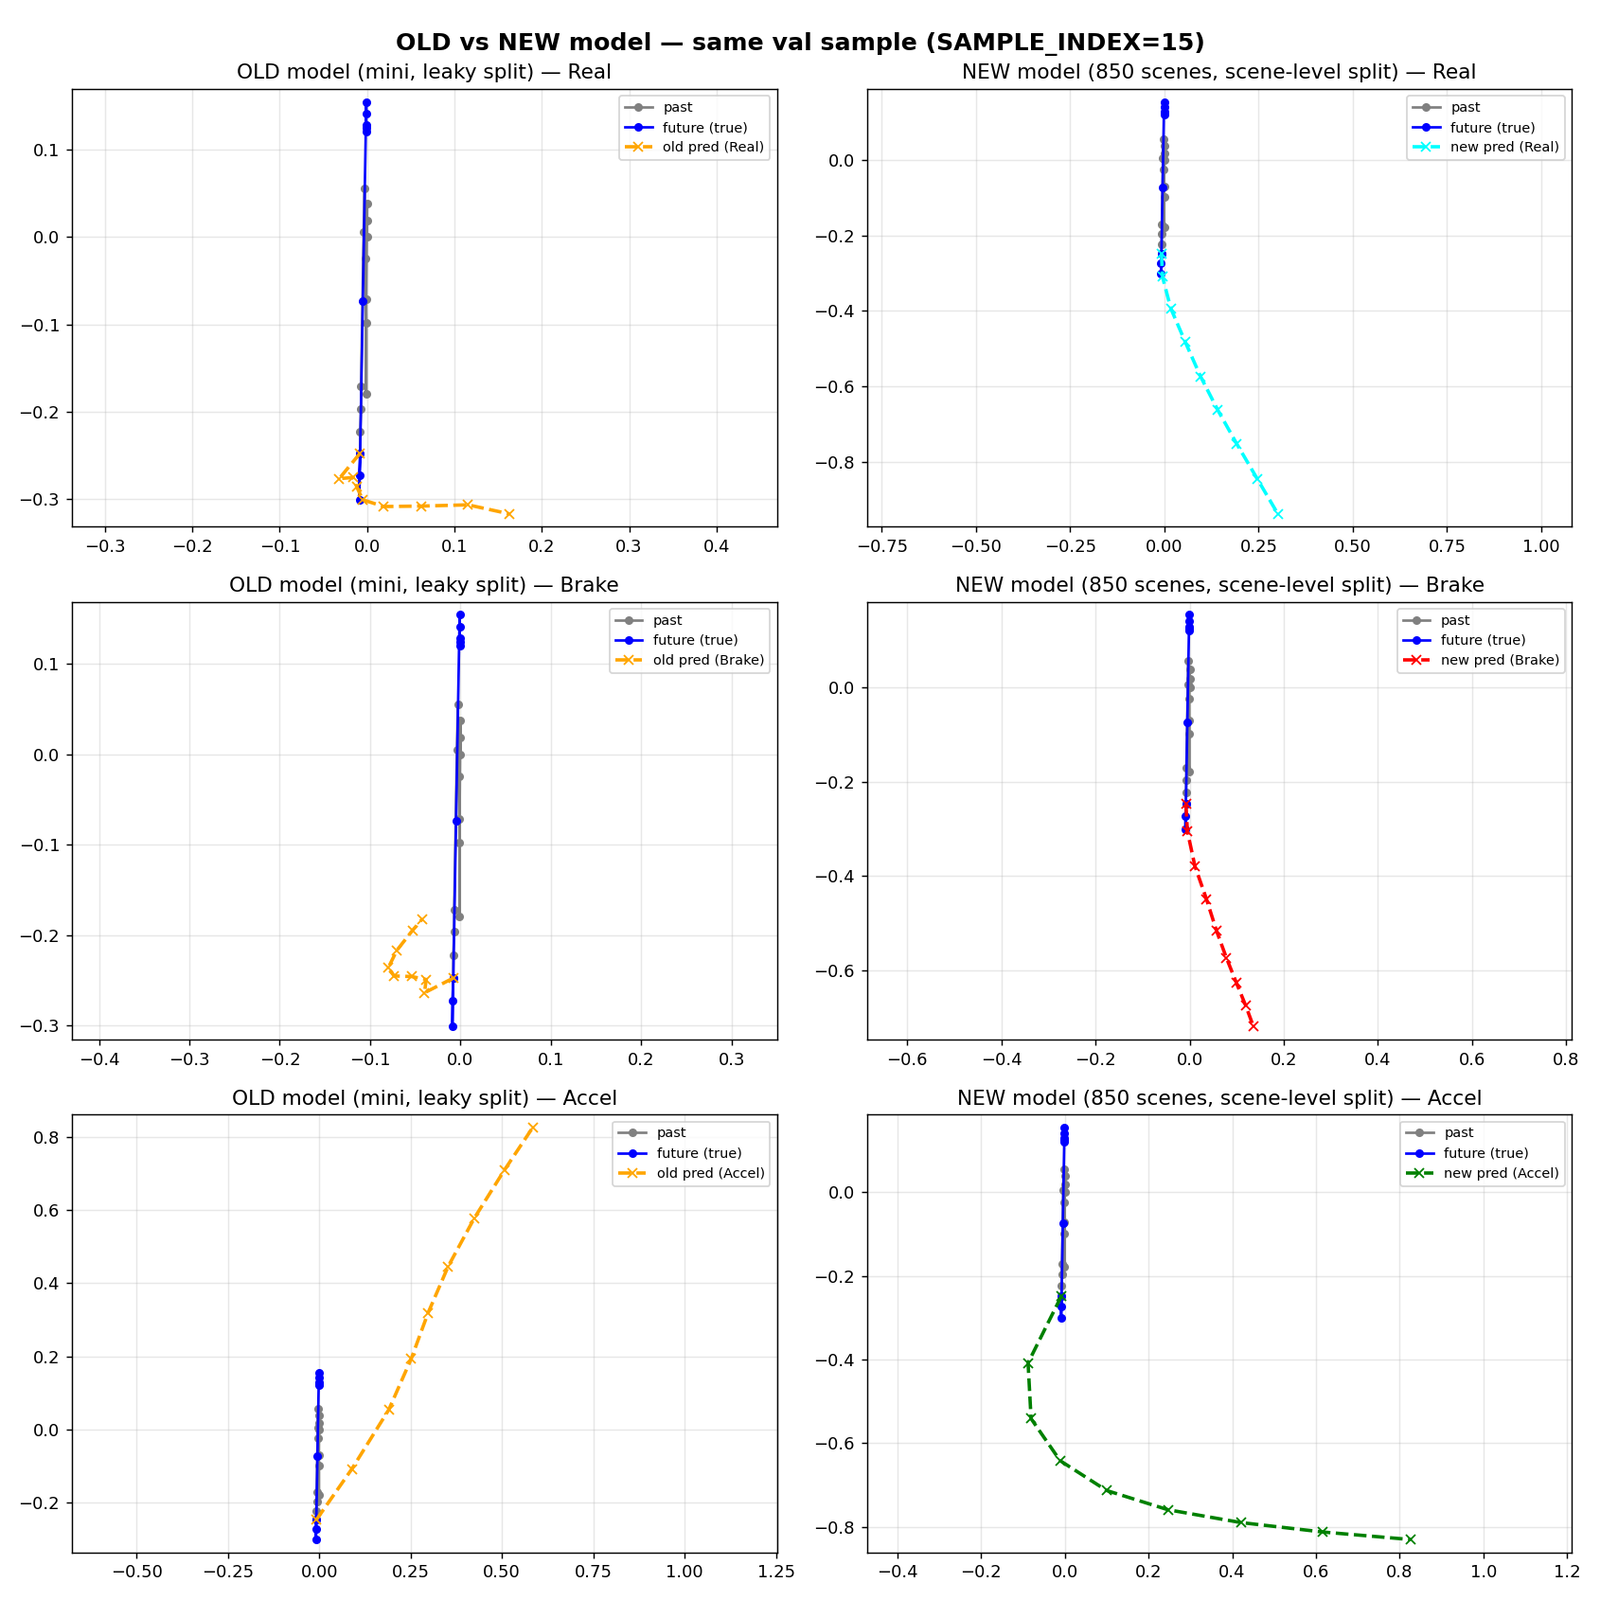
The forecast under each plan
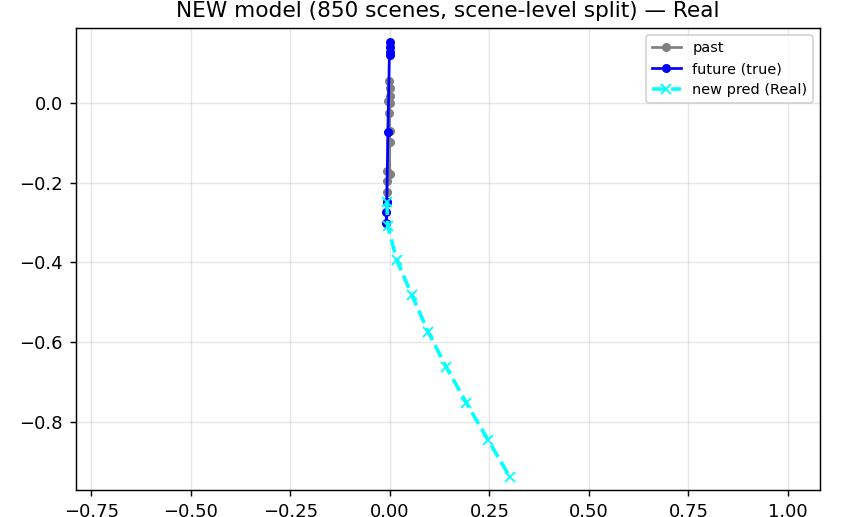
Carry on
The ego vehicle does what the driver really did. The forecast for the other road user runs down and to the right for a little under a meter.
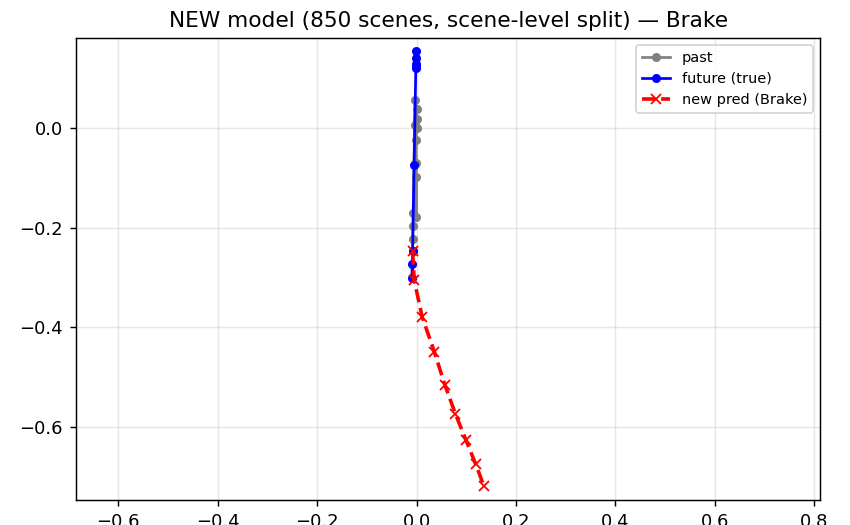
Brake
The ego vehicle brakes instead. The forecast keeps its direction but is shorter.
Accelerate
The ego vehicle accelerates. The forecast swings out and runs far to the right.
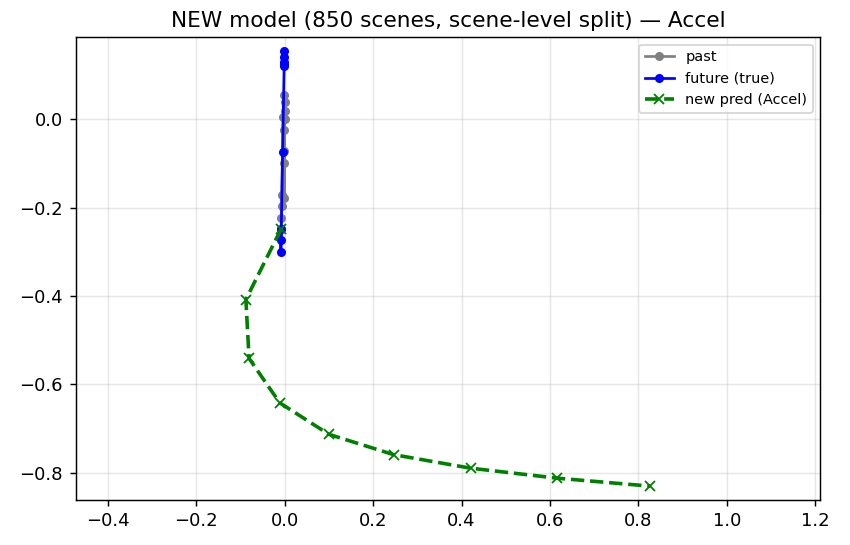
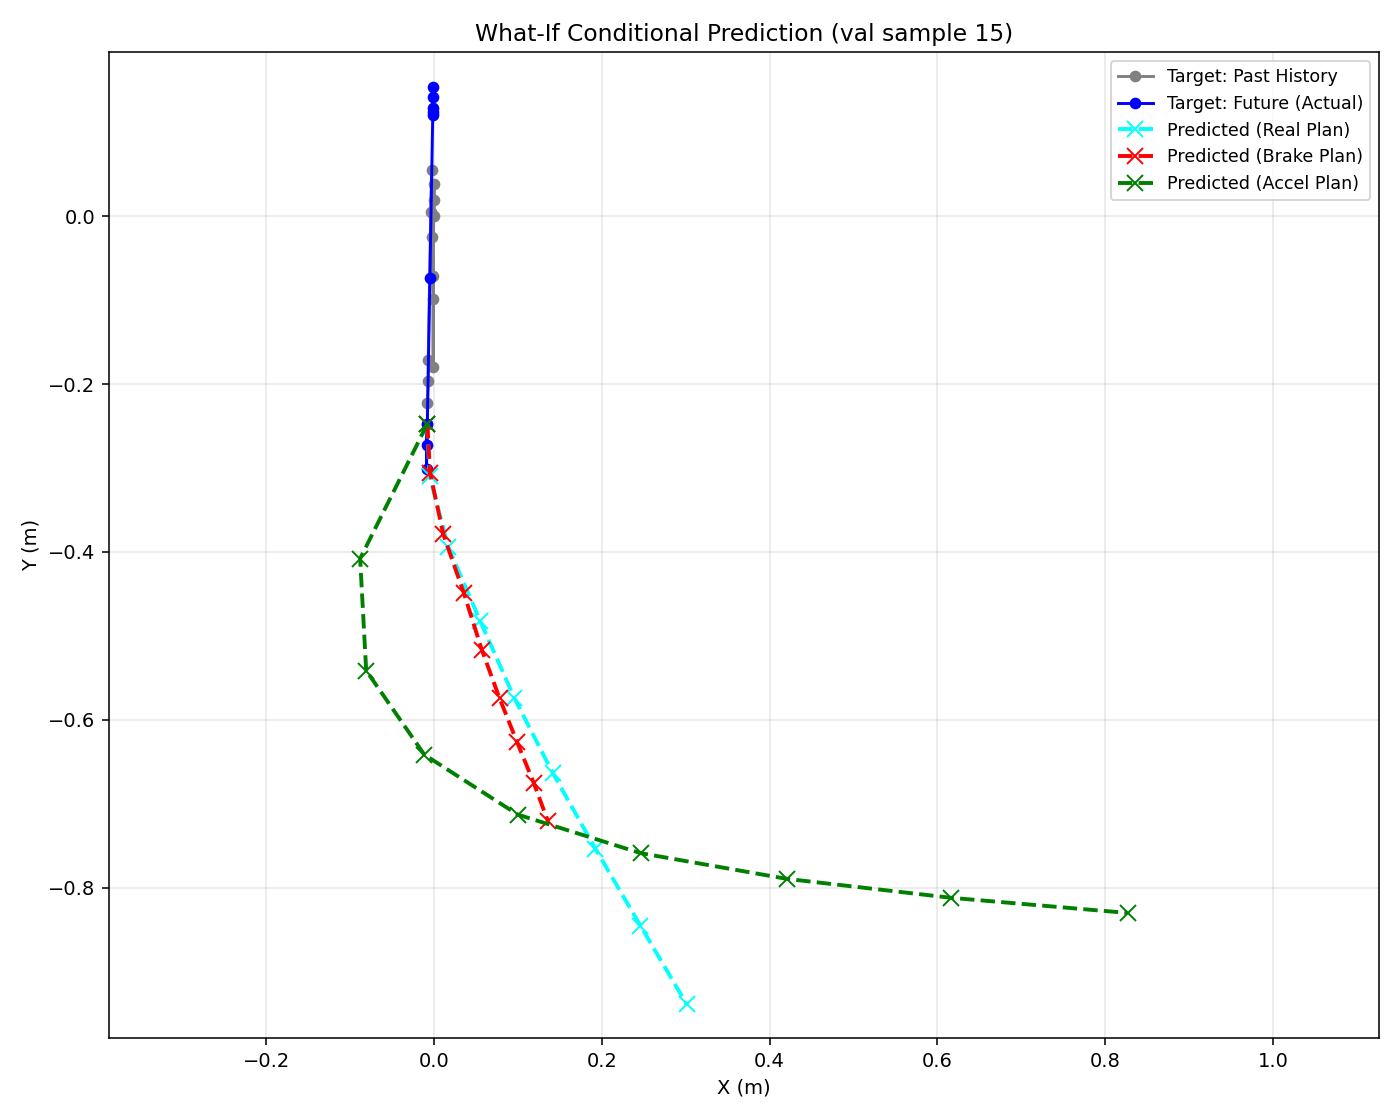
One validation sample from the 850-scene model. Gray is the past, blue is what the road user actually did, the dashed line is the forecast. In all three the forecast departs from the truth: this shows that the answer changes with the plan, not that the answer is right. The axes are in meters and differ slightly between panels.
Exhibit 03 · Chart
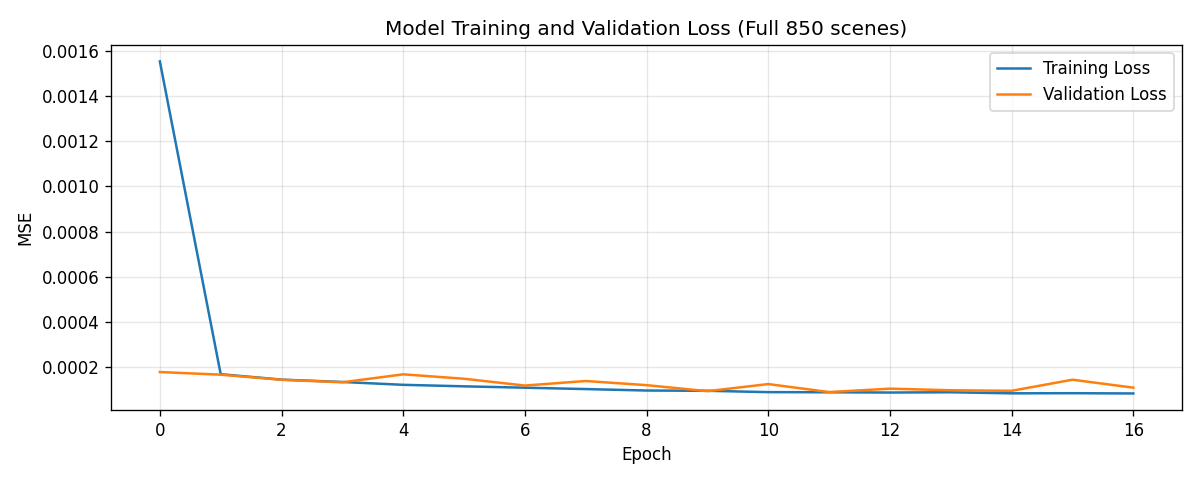
Error before and after scaling up
01
What it is
"What will that car do if I brake?" The model takes a nearby road user's recent motion, the ego vehicle's recent motion, and a plan for what the ego vehicle does next, and predicts how the other road user moves in response. The same scene can be run under three plans: what the driver really did, braking, and accelerating. It was a course research project at RV University, trained on the nuScenes driving dataset and written up as an IEEE-format paper with six authors. I am a co-author.
02
The hard part
A forecasting model usually learns what tends to happen next. This one is asked what would happen if the ego vehicle did something it did not do. There is no recording of how the other road user reacted to a brake that never happened, so a what-if forecast cannot be checked directly against data. What can be checked is the forecast under the real plan, and whether the forecast moves at all when the plan changes.
03
What was built
A conditional sequence-to-sequence model: three LSTM encoders, one each for the target's past, the ego vehicle's past and the ego plan, feeding one LSTM decoder. It has 796,418 parameters and is written in TensorFlow. A data pipeline extracts those three inputs from nuScenes: 18,942 rows from 10 scenes at first, then 1,200,336 rows from all 850 scenes, split by scene with the dataset's official 700 and 150. Around the model sit SHAP feature attributions for each plan, two simulators (about 12,500 lines of Python, one of which uses the trained model as a collision-risk predictor), a latency benchmark and a 12-test suite.
04
What was measured
There are two sets of numbers, and they should not be mixed. The paper reports the first model, trained on 10 scenes: a test error of 3.27 × 10⁻⁴ in scaled units and an average displacement error of 0.515 m/s. That model came from a notebook that split its data at random by sample, which can leak between training and test. In May 2026 the model was retrained on all 850 scenes with the official scene split: validation error 8.86 × 10⁻⁵ and an average displacement error of 0.449 m/s. Those results are in the code, not yet in the paper. Both displacement errors are in velocity space, because the model predicts velocities, so they cannot be compared with the position errors in meters that the field usually quotes. One prediction takes 26.5 ms on average.
05
What it does not claim
The paper received three peer reviews in May 2026, rated borderline, borderline and accept. The reviewers asked for displacement-error metrics, more datasets, stronger baselines and better figures. My own record gives the venue as IEEE CONECCT 2026; no acceptance notice or DOI is on file, so this site marks the venue as pending. The paper's methods section also describes things the code does not do, so this page describes the code and does not link the paper until the two agree. The plots here show how the forecast changes with the plan. In the sample shown, all three forecasts miss what the road user actually did.
Figures
One question
The answer is on this page. Get it right and it goes in your passport on the map.
Challenge· stamped
The model was first trained on 10 driving scenes, then retrained on all 850. By how much did its average error fall?
About 13%: from 0.515 to 0.449 meters per second, per the original notebook and the retrain's metrics file. The first figure comes from a split that may leak, so the true gain is uncertain.
Show the answer
About 13%. About 13%: from 0.515 to 0.449 meters per second, per the original notebook and the retrain's metrics file. The first figure comes from a split that may leak, so the true gain is uncertain.
- Stack
- Python
- TensorFlow / Keras
- LSTM sequence-to-sequence
- nuScenes devkit
- scikit-learn
- SHAP
- causal-learn
- pygame
- matplotlib
- pytest