No. 16of 22WaypointHackathons
Racing lap analysis in 30-meter micro-sectors
MSARSE
Splits a racing lap into micro-sectors of about 30 meters and compares laps sector by sector to show where a driver loses time. A team hackathon project on Toyota GR Cup data from Circuit of the Americas; the track positions are synthetic and the results are not yet meaningful.
- When
- Nov 2025
- Status
- Built
- Team
- Team hackathon project.
Progress
Progress60%
Pipeline, tests and interface exist. Results are not yet meaningful: the track positions are synthetic and the saved lap times are broken.
What comes next
- Fix the lap timing that the sampling step breaks.
- Use real track positions, or compare laps by distance without a map.
- Capture a comparison of two different laps.
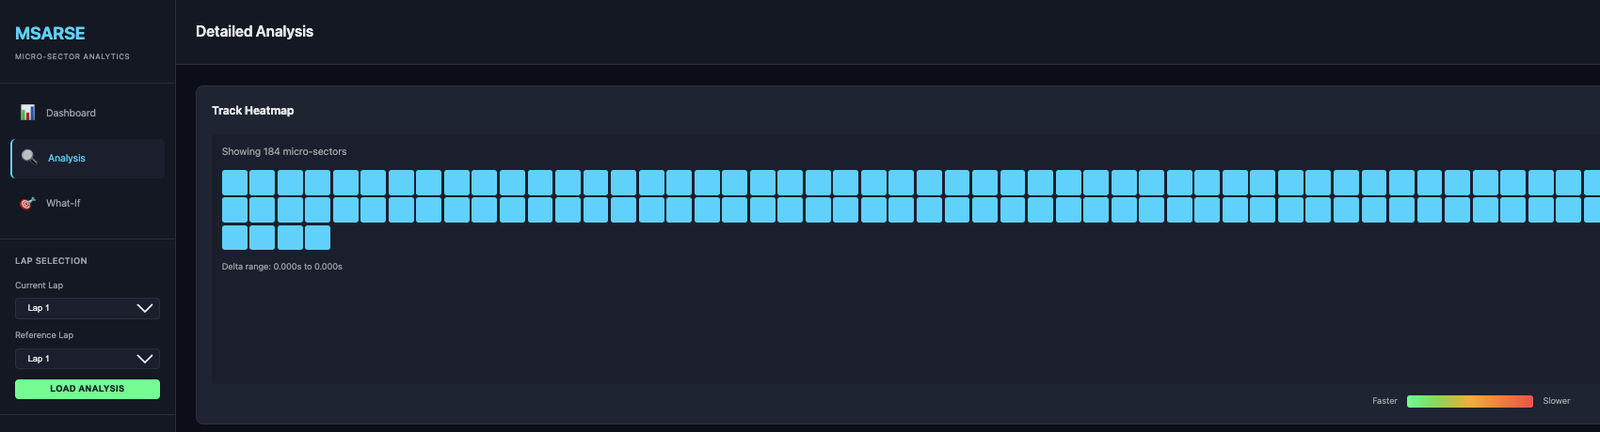
184
micro-sectors of about 30 meters on the lap, as the app shows
A count of segments, not a result. The track positions under them are synthetic: the race data has no GPS.
App screenshot and the project's run summary (TEST_RUN_SUMMARY.md)Verified. Backed by a file or public page that has been checked.App screenshot and the project's run summary (TEST_RUN_SUMMARY.md) — Read in the project audit of 13 November 2026. The run summary is a written summary, not raw output.Not meaningful yet
lap comparison results
The project's own run summary reports lap times of 17.7 s and 999.1 s, plainly broken by a sampling step.
The project's run summary (TEST_RUN_SUMMARY.md)Verified. Backed by a file or public page that has been checked.The project's run summary (TEST_RUN_SUMMARY.md) — Read in the project audit of 13 November 2026.Exhibit 01 · Walk-through
How a lap becomes micro-sectors
Step 01
Load the race files
Converters read the official race, lap and weather files for the circuit.
Step 02
Place each sample on the track
The data has no GPS, so a script generates the coordinates. Every position from here on is synthetic.
Step 03
Measure distance along the lap
A Haversine calculator turns consecutive positions into distance traveled.
Step 04
Cut the lap into micro-sectors
Segments of about 30 meters: 184 of them on this lap.
Step 05
Compare two laps
The comparator lines two laps up sector by sector and reports where time is lost. In the saved run the lap times themselves are broken, so the comparison is not yet meaningful.
01
What it is
MSARSE stands for Micro-Sector Adaptive Racing Strategy Engine. It cuts a racing lap into micro-sectors of about 30 meters and compares two laps sector by sector, to show where a driver loses time. It was a team hackathon project, coded over two days in November 2025 on the official Toyota GR Cup data for Circuit of the Americas.
02
The hard part
The race data has no GPS. To place each telemetry sample on the track, a conversion script generates coordinates, so every position in the app is synthetic. That limits everything downstream: a map of where time is lost is only as real as the positions under it.
03
What was built
A Python package with a data loader, a Haversine distance calculator, the micro-sector engine, a lap comparator and plotting. A command-line tool and converters for the race, lap and weather files. A Streamlit app, and a FastAPI backend with a small web front end. Seven test files, some of them property-based. Despite the name, there is no machine-learning or strategy model in it.
04
Where it stands
The pipeline runs end to end, but its results are not meaningful yet. The project's own run summary reports lap times of 17.7 and 999.1 seconds, which a sampling step has plainly broken. It was team work, and this page does not single out who did what. No result from the event is on record.
05
What I'd change
Fix the lap timing first. Then find real positions, or drop the map and compare laps by distance alone. And capture a comparison of two different laps: the only screenshot on file shows a lap compared with itself.
Figure
One question
The answer is on this page. Get it right and it goes in your passport on the map.
Challenge· stamped
MSARSE draws its laps on a track map. Where do the positions on that map come from?
A conversion script generates them. The race data has no GPS, so every position in the app is synthetic. Source: the project audit of November 2026.
Show the answer
A script that generates them. A conversion script generates them. The race data has no GPS, so every position in the app is synthetic. Source: the project audit of November 2026.
- Stack
- Python
- pandas
- NumPy
- geopy
- plotly
- folium
- Streamlit
- FastAPI
- pytest
- Hypothesis